Friday, January 1, 2016

Policy choices in Environmental System

In this post I will discuss some research articles which has attempted to analyse policy scenarios in environmental system. Because both, policy making and environmental system are complex, choosing best alternative is often hard. Thus, my focus will remain in system thinking in environmental system that could support choice of best alternatives in environmental policies.
System Dynamics: System possess different subsystem and circular causalities among them. The advantage of system dynamics over other model is its ability to study whole system rather its element and identify how a causal loop can effect the whole system. The figure below describes system dynamics.
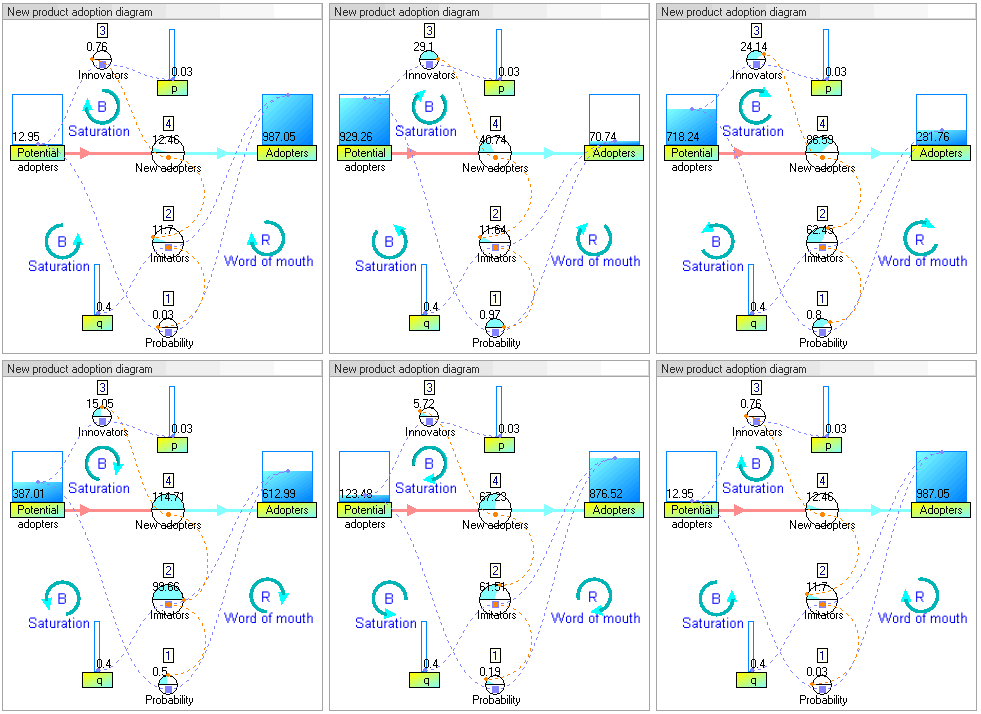
An illustration of system dynamics. wikipedia.org

Ghaffarzadegan et al. (2010) discuss about the usefulness of System Dynamics models (SD) in policy making with examples from urban planning and social welfare. They discuss some problem associated with public policy like resistance from environment, need and cost of experiment, persuade stakeholder, think of subsequent and indirect effects etc. They argue that even a simple system dynamics model with some important causal loops can also resolve policy problems through simulation or prediction.
Wang et al(2008) has studied a complex urban transportation system in China. They used Vensim PLE to simulate the effect of seven subsystem to the transport system. The model was validated by comparing real observation of 2005 with simulated estimates using 2000-2004 data. The sketch of the causal loops among subsystem is given in figure below.
Different subsystem and their relationship with each others. From Wang et al.(2008)
 Their focus variable was vehicle ownership which prevent environmental degradation by reducing emission. The result show that flexible restriction policies would help GDP and population grow without further degradation to environment. The main recommendation are  a) restrict vehicle ownership that is acceptable, b) restrict private ownership with better public transportation and c) restriction policy implemented with research in emission reduction technology. This shows that different factors simultaneously affects the system and effective policy options can be developed with sets of variables to achieve sustainable development.  (Wang, 2008).
Guan et al. (2011) attempted to couple GIS with system dynamics model to observe the effect of different policy scenario in urban system from 1453 village. SDM was developed and validated using cross section data. Different scenario was  developed by varying parameter and variables like current with as usual, economy with higher input of capital and labor, resource with reduced elastic coefficient for resource related variable and environment scenario with higher investment in environment protection. SDM was used to simulation for 2050 AD. The 2050 result was used in GIS for spatial analysis. The figure below shows the result for sustainability. They conclude  most effective scenario is environment. 
Simulated result for sustainability for different scenario. Adopted from Guan et al(2011)
Policy making in environmental system is also contained by engagement of different stakeholders and concern for economic loss. The paper discussed above are some policy studies which used System Dynamics modelling (SD), and suggest that it can be of help not only to understand complex environmental system but also to use it in simulating policy  scenario and  identifying appropriate strategy. There are several circular causalities among environmental intervention and socio-economic factor and all of them are important to human welfare. SD can help to track the option that has highest benefit to overall system.
Although it is hard to recommend what each should do to achieve the target of 2 degree Celsius. However I see SD can be used to simulate potential scenarios and find appropriate policy at regional and local level to ensure responsible contribution for global climate change mitigation. 
Happy New Year  2016.    

Sunday, December 20, 2015

A sensible choice of a common,

Stern (2006) suggest even if emission peaks in decade or after; the impact on global warming will be large; with effect associated with water like drought, flood etc. The paper argues climate change externalities are public with no incentive to agent who cause it and underdeveloped countries are predicted to suffer more than one with good economy to adapt it. Communicating the Stern(2006) view, The Guardian mentions "Climate change is the greatest and widest-ranging market failure ever seen." The paper recommends three policy actions; a) carbon pricing, b) technology policy and c) energy efficiency and suggest that early effective action will outweigh the cost. Nordhaus (2007)  reviews the Stern(2006) and mention global warming is a problem which doesn't differentiate state boundaries and might result in loss of 5%, conservative estimate and upto 20%, wider consideration, in GDP. Looking at the estimates and recommended action it feels that many issues are related to economic activities we are performing. Thus, In this post, I will  suggest how a sensible choice of an individual or household can help climate change mitigation and making "A World" a better place than before.

Saturday, December 12, 2015

Choices: E,Mission for 2°C

I am writing this post just after COP21 presidency has tabled the draft of agreement among representative of more than 195 countries. The draft contains binding actions and commitment to support for achieving warming well below 2°C (see previous post) toward achieving 1.5°C.  In this post I will try to explore the choice that is among us. The choice between mission toward 1.5°C or emission toward more than 2°C. 
Wealth of literature including Meinshausen et al.(2009) has showed increased emission of GHG will increase temperature. They estimate if CO2 emission is limited to 1000Gt in 2000-2050, it is 25% likely the temperature exceeds 2°C and 1440Gt to 50%. They also suggest if 2020 emission is more than 25% by 2000 level, the probability of exceeding 2°C will be 53-87%. See figure below:
However, the effect of emission doesn't end here. Solomon et al. (2008) shows that the concentration of CO2 and climate change it has caused, are not imminently reversible. They discuss further release will push toward more complicated irreversible climate change. 
To Limit irreversible climate change and global warming less than 2°C, emission of CO2 should be controlled. I have discussed about the trillion ton carbon in previous post which will  force 2°C Considering 1000 GtC. as a total budget avaiable budget from 1800-2100; IPCC has prepared a carbon budget. It estimates that available balance with 66% probability of achieving the target of 2°C is 184 GtC. More budget will be available by loosing the probability of achieving like 234 GtC with 33% probability. See figure below.
Carbon budget over time. From: IPCC carbon budget
From the graph above it is clear that we have limited available balance and if we want higher confidence the balance will decrease allowing fewer emission. Reduced carbon in another part might have immediate economic loss. A preliminary analysis by Elzen (2014) shows that achieving  2°C target will cost maximum of 6% of GDP, however will regain the growth after peaking at around 2055. 
We are not only the source of CO2 emission but a potential victim of climate change. We now have only two option left. Either choose "emission" and get prepared for disaster or collectively work in "mission" to make sure temperature rise will remain well below 2°C.
pubs.acs.org
 While concluding this post, COP21 has reached in an agreement to reduce the global warming below  2°C. With this choice of the century; now it is time to make a choice to materialize the commitment. I would like to thank all concerned and global community for setting this landmark target. Now, my urge is for making a sincere choice among emission-to breach and mission- to keep the target well below of 2°C. First one have short term gain with then ever pain and second one has some pain recently then ever gain.

Saturday, December 5, 2015

Choice of the century: >,2,< °C ?!?


COP21 is happening. UN General secretary has urged all states to work faster and effectively to reduce emission and achieve target of 2°C. He also mentioned that even this target will pose threat in food/water security and economic stability. Scientific communities engaged in climate studies, in another hand, are warning 2 °C would also pose a risk upon earth system and this is political rather science. They add climate projection could not have considered some sudden event or tipping point of forcing like carbon dioxide, which would proliferate the rate of warming. Smaller Island States are demanding for 1.5°C target, which is safer but far too ambitious. In last post of November, I have discussed about the trillion ton carbon, which forces the 2 degree Celsius  and a chunk of it has already been released to atmosphere. As available budget is only left,  it is challenging to remain below the desired level.  Along these different ideas, demand and discussions, almost all nations participating in COP21 seems to agree on agenda to limit global warming by 2°C as compared to pre-industrial level by 2100 AD. IPCC clearly mentions about the range of likely temperature at the end of this century. Clearly, the choice has become an issue of debate
An article in The Independent indicate even scientific community are not certain about system behaviour at 2°C and nature of radiative forcing above 400 ppm of carbon dioxide Yoshimori et al.(2001) has also showed reduced forcing at different level of concentration. Martı´nez-Bot et al. (2015) discuss about the different extent of radiative forcing of carbon dioxide at for our Pliocene-like future and suggest the current prediction of radiative forcing, an increase of 1.5 K to 4.5 K per doubling of CO2, is more probable to happen.    

From : IPCC AR5 synthesis report .
Tschakert (2015) discuss about how the target of two degree Celsius developed and how good is it. The author describe jump from 1.5 to 2 degree Celsius as move from moderate to close to high risk zone and is an midway. Jaegar & Jaeger (2011) describe different views in °C target. Catastrophe view as move to domain of  safety  from  catastrophic whereas cost benefit view it as optimal efficient, and focal point view as measure to bring a effective coordinated solution which is lacking at present. They argue politician treated the target of 2°C as scientific and scientist as political view. They suggest demonstrative effort can be the right start.    
From: www.Carbonbrieforg
IPCC 2015 press release describe the economics aspect of 2°C target. Some of the condition to meet the target are a) reduce emission by 40-70% by 2010-2050, b) negative emission by 2100, and c) these reduction effort should not effect the economic stability. 
Anderson (2015)  describe the economics aspect of the  2°C and mention it need huge change in trend and reversing the past (reversing rapid emission to negative emission). Author suggest that scientist should communicate their finding clearly and candidly, so that it could be rightly be used by concerned community. This suggest that it is challenging to meet the target. 
COP21 has also clearly mentioned about "Why 2°C. The video explains the crux of choosing it.


Reviewing these ideas, it becomes clear that 1.5°C is definitely better but "How?" hinders to adopt it as global target (also remember the climate denial, which we mentioned in previous post). More than 2°C is simply catastrophic. In this situation limiting at 2°is a effective way of bringing out collaboration among all state and organization. I was reading a Facebook post where someone was thanking for Uruguay's promising progress in clean energy. My personal idea and urge is to understand 2°C as maximum allowed and work together to bring down as possible and if we all try it is maximum possible. As the choice of 2°C is related with us and whole living system,  this is why I mentioned it as choice of the century.
From: s3.amazonaws.com


Saturday, November 28, 2015

Trillion Ton Carbon, Temperature Hiatus and climate change denial !!!

With the publication of more and more threatening results like glacier melt, possible but ambitious 2 degree Celsius, world map might be changed etc. global engagement on #actonclimate is also warming up. COP21 has arrived. However, these engagement is still not concrete enough to get translated into action, and this is where COP21 has great hope. Here in this post I will try to track how uncertainty in scientific prediction leads to denial by interest groups, which then forces climate policy dilemma.

Saturday, November 21, 2015

Sixth Great Extinction: Do we care !!!

From the start of this blog, my focus is at human behaviour, how it is forcing climate change and leading overall living being into crisis. This is also an urge for all of us to think and act responsibly. Some of the issues mentioned before are quite behavioural, soft and appealing. Whereas some issues might be quite new and different to you. Here in this post today, I will discuss some papers that has mentioned about upcoming Great Extinction, Palaeoclimatologist has describes about the five mass extinctions in different phases of earth climate change. Now different studies are arguing that  sixth mass extinction has now started.


Dinosaurs went extinction before about 65 million year ago during Cretaceous. Now the Holocene seems to be the worst scenario after than on biodiversity loss. We have already loss 338 + 279 (extinction at wild) species of vertebrates since 1500AD (IUCN red list). Ceballos, et al. (2015) uses lower than conservative for mass extinction rate estimates. 2E/MSY  i.e. 2 mammal extinctions per 10,000 species per 100 years. IUCN extinction list was considered for analysis. Although the estimate was based on half of conservative rate, using which should increase the extinction period, the result showed that  the extinction rate was 100 times more than than the background rate for mass extinction. Based on this estimates of  extinctions, the species that went extinction in 20th centuries would have lived for another few thousand of year. This could be a hint to Sixth Great Mass extinction.  
Adopted from: Ceballos et al. 2015
Similarly another paper by Barnosky et al. (2011) has used palaeontological information coupled with IUCN red list to access the extinction of vertebrate in recent and historical mass extinction. Holocene extinction has been analysed by using short period of time and matched with historic extinction in millennia. The paper suggest the rate of current time extinction is higher than it was during previous mass extinction, indicating Holocene mass extinction has started,
Leakey and Lewin (1996) estimates that 30 thousand species get extinct each year because of human activities. Wake et al. (2008) has also observed a very critical status with amphibian, which could by now entered the mass extinction phase.    
The sixth mass extinction are forced by Human activities and there are none to blame upon. Both of the paper focus on effective conservation effort that could help reducing the extinction rate. 

Source: Coreaybradshaw
             

Sunday, November 15, 2015

Plastics in Ocean: Formation of Garbage Patch and a way to mitigate it.

Levey (2015) mentions, "90% of sea bird sallow plastic"; which is reinforced by Wilcox et al. (2015) recent article, suggesting that threat of plastic to sea bird is increasing and spreading. Plastic wastes is major source of land and sea pollution. No wonder, plastic has revolutionized the global economy, however, increase in its use are responsible for environmental degradation, especially in ocean (Gregory, 2009). In this post, I will review three papers, which insight the composition of beach litter, formation of garbage patch and making international mechanism on sea pollution work better.
Kordella et al. (2013) studied the litter collected from volunteer clearer from 60 beaches along Greece in 2006 and a year later. The collection location consist of island, gulf (open and semi-open), lake etc. The litter is categorized broadly into metal, plastic, building material etc. Sources were classified broadly into land based (recreational and other); and marine based (navigation and fishery). R-factor and hierarchical cluster analysis method were used to analyse the data. Around 110 thousand items were observed. Among which plastic constituted 43% a dominant source of sea garbage. The analysis showed, plastic having dominant composition, affects beach regardless of its origin and location. The study suggest supply of solid waste facilities would help reduce these waste enter into ocean.